
People who say you can't time the market simply don't know how to trade. Make your own judgment calls by using these macro indicators.
How to Manage Risk and Gauge Stock Market Health
Before I get carried away with all of the "Macro-Indicators" in this blog, I need to emphatically state that the ultimate gauge for any market action is your portfolio.
If you notice the stocks you own are getting clobbered, there is a high probability that they are in a group that is not favored by big buyers... big buyers being institutions and in this day and age - even retail traders. Having a winning strategy will result in you naturally being stopped out if you manage risk way before a true market meltdown . This is the ultimate market barometer. It's also a good way to find out if you had too much exposure and can stomach your trading size.
If the market rolls over and you are down 10% or more, there is a good change your stock selection, timing and position sizing is off-point.
Once you have been knocked out of a few stocks, it becomes a question of "when do I get back in". Luckily, the indicators that get me out, get me back in too. Here are a few of my favorites and how they work.
Macro Indicator 1 - Market In Distribution
The concept of distribution days is nothing new. It was coined by William O'Neill in his book "How to Make Money in Stocks" (must read).
The basic premise seems very obvious. If the market is selling off and the volume is larger than normal. There is a high probability it's institutions dumping stocks, not me, you and a mate from work.
The chart below during Corona panic depicts this perfectly:
Distribution Days on Heavy Volume
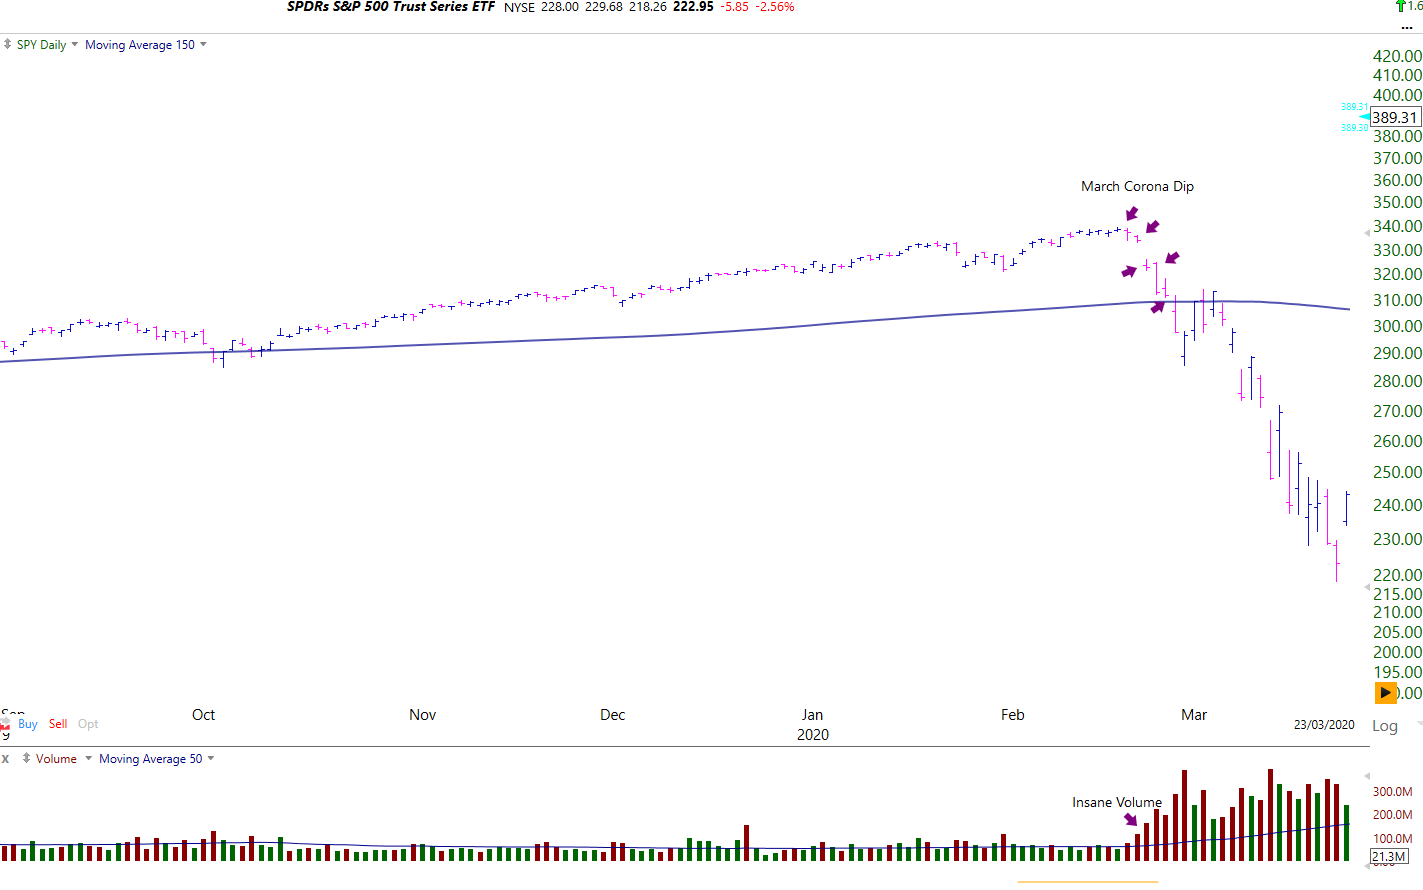
In every market crash with very few exceptions, if you were out of the stock market after 5 or 6 heavy days of selling with high volume (as above), you may get hurt but you won't get annihilated.
The first clues are increasing sell volume (zoomed in view here):
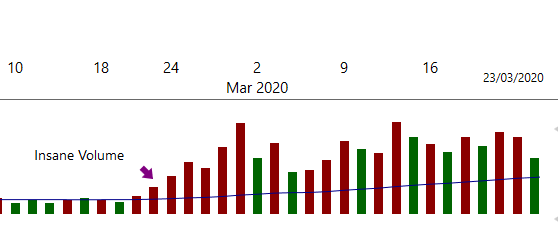
It is very easy to sell and buy a stock back later, but holding during these institutional dumping sessions is not smart. It's important to remember, if a stock or asset drops 50% in value, you need 100% to get back to break even! If it drops 90%, you need 900% to get back to even.
The general rule is, if there are 5 or 6 heavy distribution days in the large indexes, there is a high probability the correction could turn into a bear market. Not always, but enough to be okay with losing some gains as opposed to losing my house.
If you do hold stocks during these periods, typically your stop loss will get you out before this becomes a real problem if you manage risk. If however you hold stubbornly onto your "darling" stock. It could cost you 50,60 or even 90% losses. When the market picks up again, you will be sitting on losses with cash you could have put back to work in the right conditions.
Macro Indicator 2 - Long Term Moving Average (150 Day)
This is very specific to market averages, so I look at the $SPY, $QQQ and other key markets. This is probably one of the easiest and most important gauges of overall stock market health.
The general rules are simple:
- If price breaks the 150 SMA it is a sell signal
- If the 150 SMA is pointing down, it's not time to get overly aggressive
- If above - lucky guess, you can bet more confidently
Example 1 - Covid-19 Market Crash
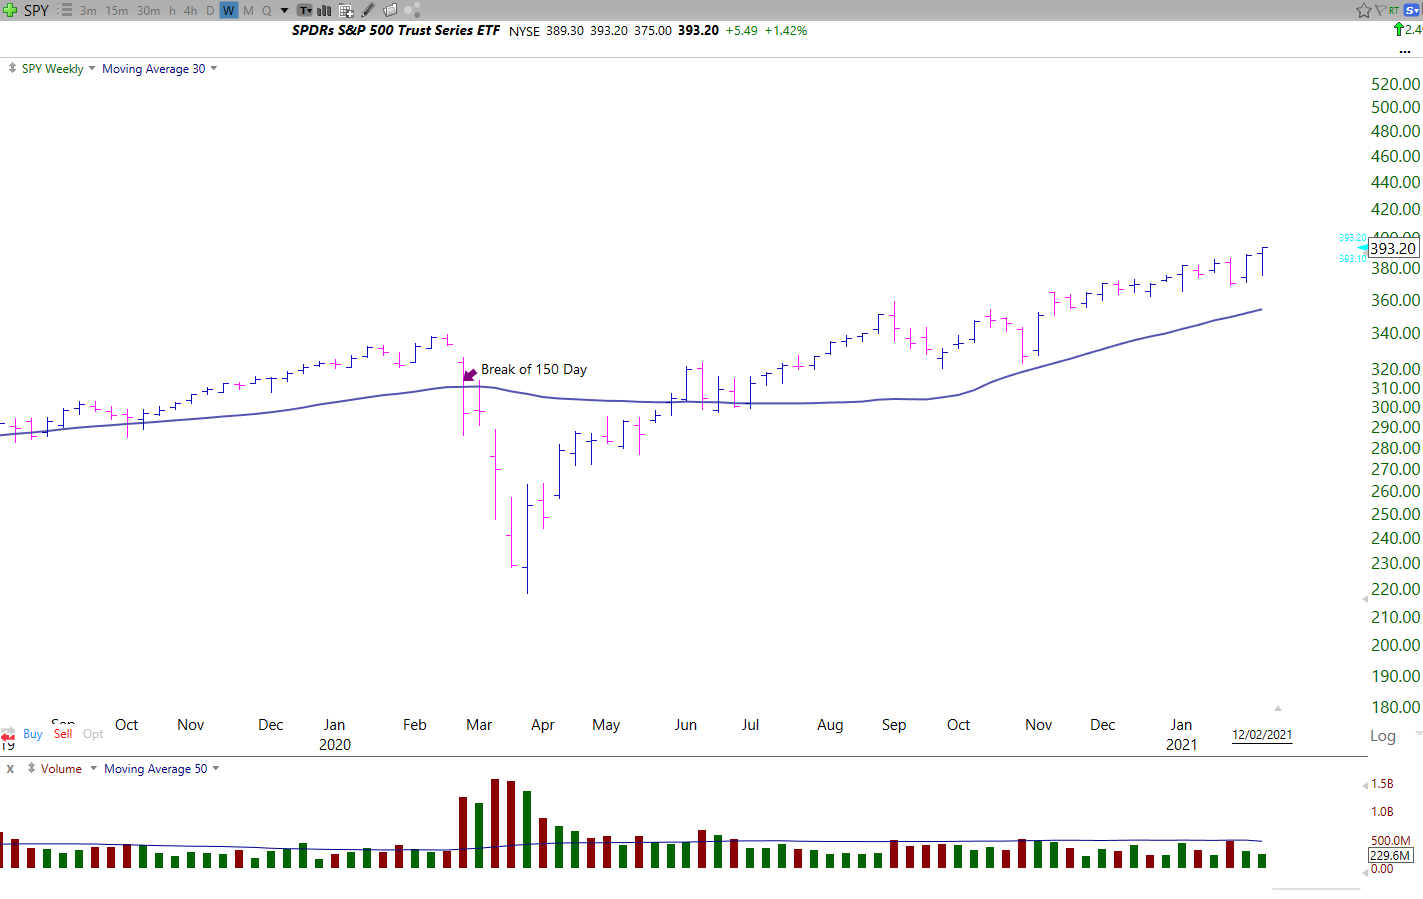
The most recent example of this was the Corona crash. I had very few stocks still in the market but this was a very "red alert" sign to clear out any remaining cobwebs and move to cash.
Example 2 - 2008 Crash
The "Great Crash" was even easier to spot for trend and price action/volume traders as the clues were stacking up long before the market turned sour.
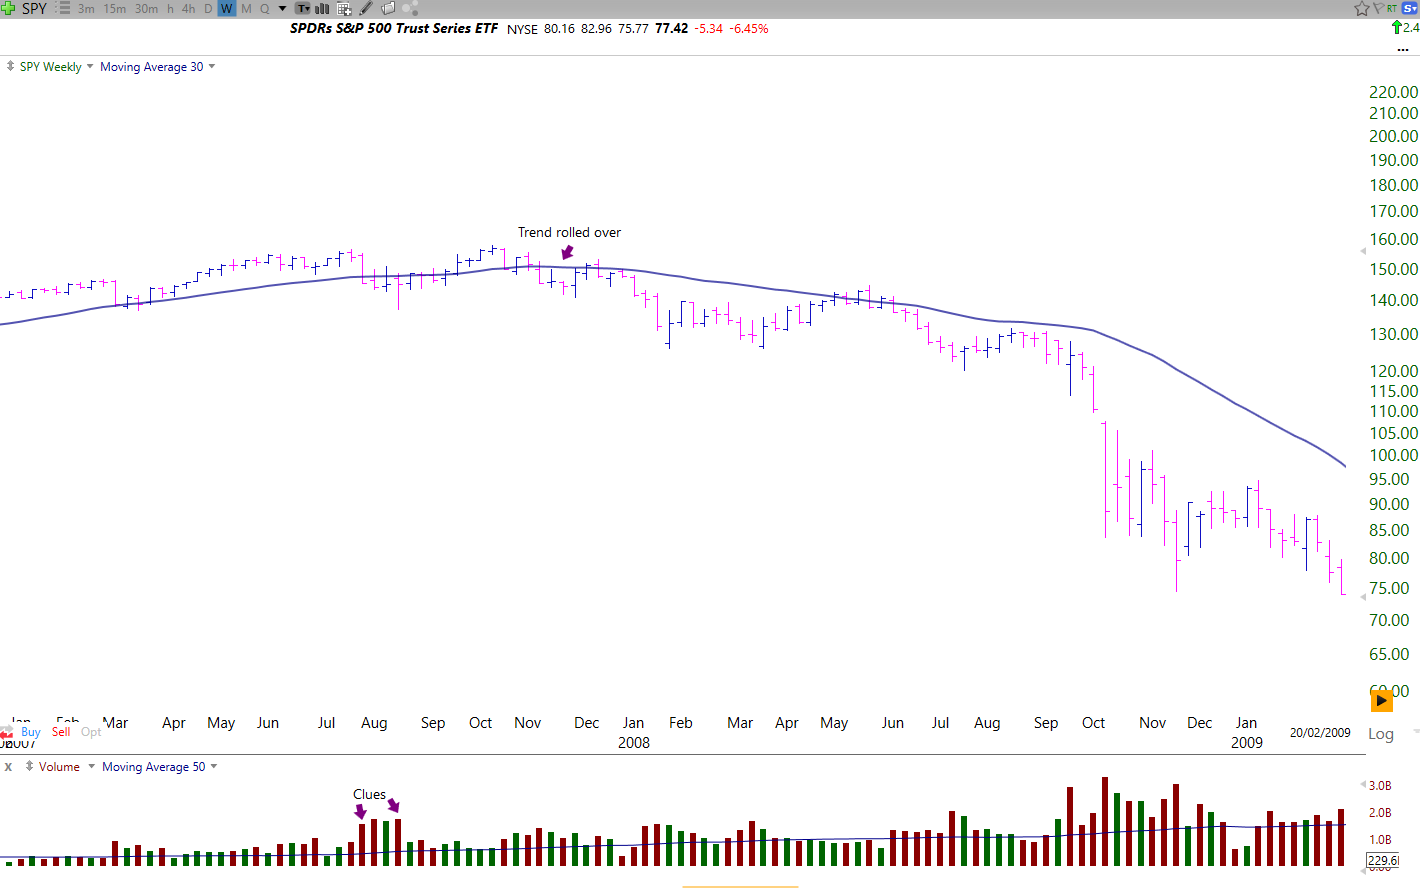
The signs were textbook perfect:
- The selling volume started picking up where I marked "clues"
- The trend turned downwards
- A series of lower lows and distribution days ensued
It's beautiful because the same principles can be applied to almost any trend or even currency baskets. An example below from 2014:
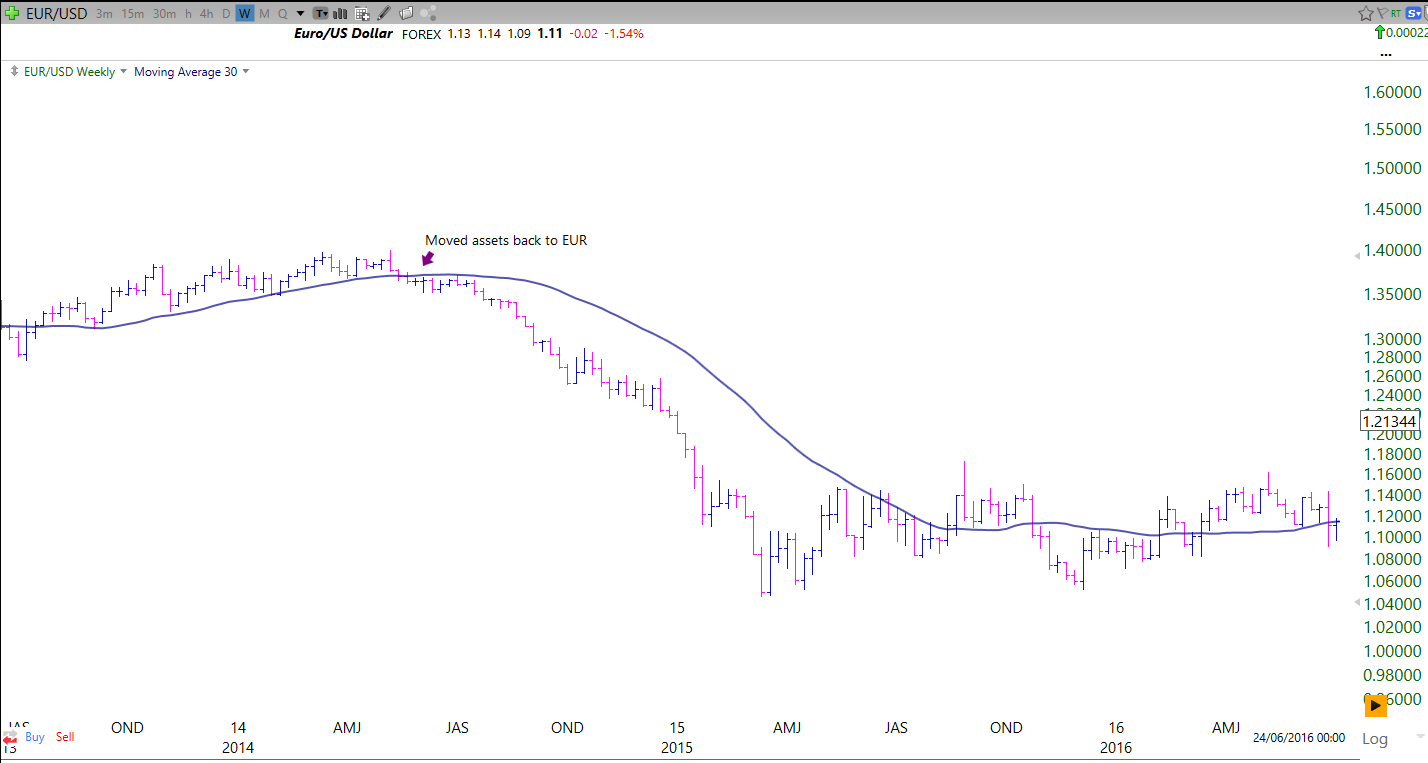
If you held USD during this time, your buying power in Europe would have declined 25%.
To summarize. Keeping an eye on the 150 SMA has helped me save money, increase buying power and stay clear of trouble. Not once, not twice but several times. The indicator is simple, following it depends on how much "hopium" you are smoking at the time.
The Newsletter
Sign up to get a monthly email about my trading journey, what I learnt or failed to learn and receive exclusive access to unpublished material and resources.
Macro Indicator 3: VIX
The VIX or "Volatility Index" is a bit more nuanced than the other indicators. I won't dive into the detail of what it is but further reading can be found here.
The below screenshot is the VIX also using a 150 day moving average. Some prefer Bollinger bands and other indicators but it's rather arbitrary for retail traders.
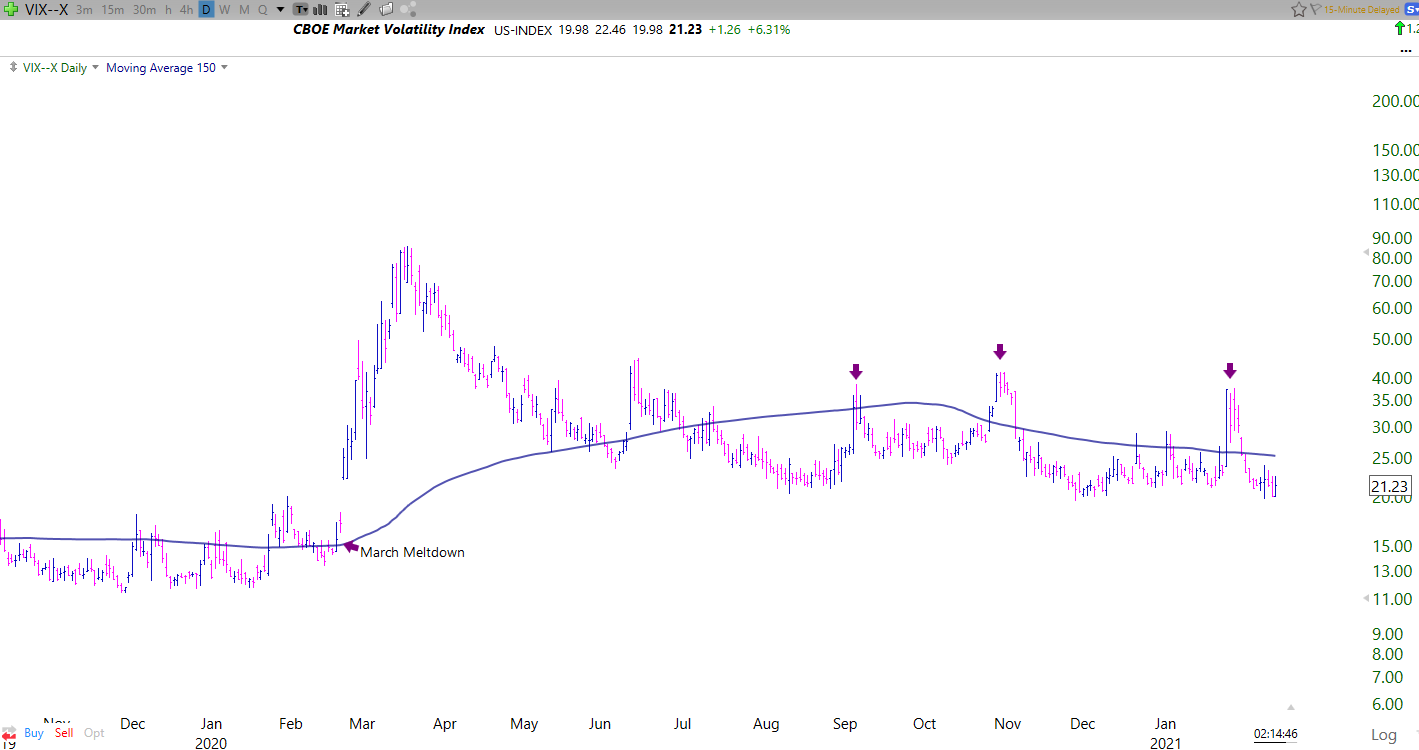
The key "take-away" using the VIX is to basically proceed with caution when it breaks a long term average. Certainly if it holds above the long term average I will move into cash or not add any trades.
Once the VIX falls below the moving average I am more inclined to increase exposure and be more aggressive.
All of the indicators need to be used with the context of your portfolio. I wouldn't sell a stock accelerating higher due to the VIX being above a trend-line, I would however tighten my stop loss and not take on chunky positions. It's a measure of "future" risk being priced into the markets and as we all know, markets can be wrong! Unfortunately, they can also be right. A good in-between is to play it safe and think risk first.
Macro Indicator 4: % of Stocks Above the 200 Day Moving Average
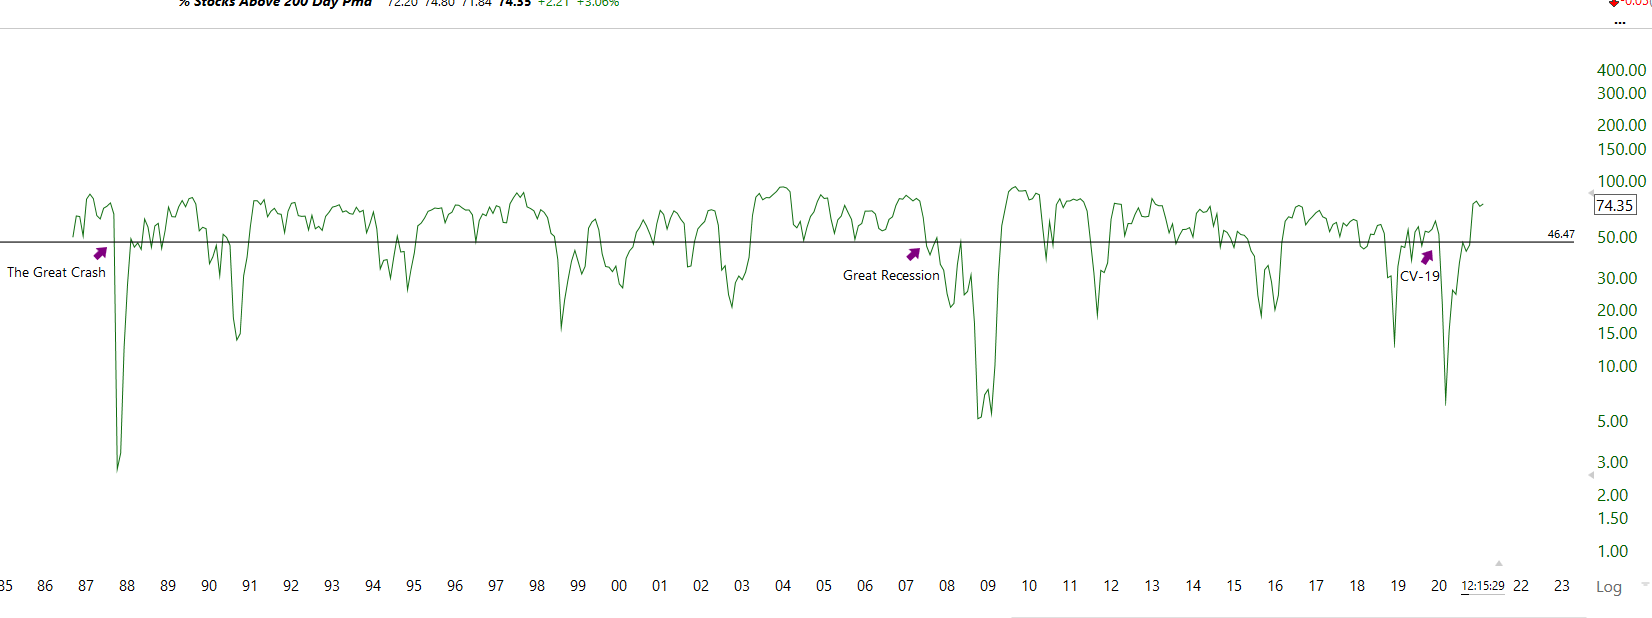
The chart above shows the number of stocks above or below the 200 day moving average using a monthly time-frame. Read more about how to read the 200-day moving average.
I wanted to illustrate just why it is we trade with momentum and trend as opposed to against it. The line through the middle is just a simple self-drawn horizontal line around the 50% mark on the Y axis which represents the % of stocks above the 200 Day moving average. So right now around 75% of the whole stock market is trending upwards (printing press is online).
This is super basic! Essentially, if more than half of the market is in a major downtrend, it makes sense to either be out, short or raising cash. The reverse is true (like now) where the market is doing well and many stocks are participating in the federal reserve fueled rally.
A further observation I have made - is when this indicator stays high for some time, it can be risky to increase exposure. You can observe on this chart as it hits this ceiling a few times it eventually capitulates. I don't make too many instant decisions on this fact, it's good however to observe.
The overall indicator is a good barometer for just how bullish the macro-environment is and how close we are to coming back to reality.
Quick Wrap Up
I use other sentiment indicators such Put & Call Ratio, Consumer Price Index as well but don't want to go overkill on these. Most of them are a science project that keeps me just paranoid enough to always sell too soon (lol).
Unfortunately I have abused these indicators in my early days and created some horrific confirmation bias moments. As the saying goes "you can beat the numbers into any shape you want them". Macro sentiment is the same. It's easy to get absorbed into negative emotive framing looking at the "big picture". That's why they can't be done in a vacuum.
If I have learned anything over the last 10 years of trading it would be to let the stocks and their performance lead your decisions and the macro pointers to keep you away from the rocks.
Everything needs to be looked at with the context of what's going on, how you react to certain trading environments and of course your trading style and hang-ups.
Using Macro to shape your portfolio in retail is just about when to step on the gas or put on cruise control, in some cases to avoid oncoming traffic.
In relation to where they fit into your own trading plan, it's important to focus on far more practical and important steps when starting out. Most notably, price action, basic chart patterns and risk management. In fact, if you looked at no macro indicators at all, risk management would by far be the most important of all skills to develop in trading. Rule #1 will always be to not lose money. Hard to play the game if you don't have the chips.
Write to us, stay in touch and happy trading. Thank you all for your continued support.


